The months of August and September arrive as the S&P 500 and other market indexes are near all-time highs. But, investors could be in for a rough two months if history is indicative of future results.
What Happened: The trading week will end in July and bring with it several key events including the July FOMC meeting, July unemployment figures and earnings reports from several Magnificent 7 members.
On Thursday, August starts and brings with it the worst two-month stretch annually for investors based on past results.
Freedom Capital Markets Chief Global Strategist Jay Woods shared the tidbit in a weekly newsletter.
“Thursday kicks off the beginning of the worst two months — August & September — that the market has performed over the last 20 years,” Woods writes.
In the past 20 years, the S&P 500, which is tracked by the SPDR S&P 500 ETF Trust SPY, is down an average of 0.4% during August and September. The S&P 500 was up 10 years and down 10 years for the two-month stretch, making it a near coin-flip on whether the index is positive.
The S&P 500 is down three straight years for the two-month stretch with 2020 the last time the index was positive for August and September.
This could be good news for investors as the 2024 year shares something in common with 2020 with both being presidential election years.
The S&P 500 Index is often up in presidential election years and during the August and September stretch the last five times was up an average of 0.05%.
While this is a minimal return, it represents a potential positive to get investors through the roughest stretch of the investing year.
Non-presidential election year 2019 was flat in the August and September stretch.
Read Also: EXCLUSIVE: Market Strategist Jay Woods Says ‘Rotation In Small Caps Is Just Starting’: Russell 2000 Within 8% Of All Times, ‘Easy Upside Target’
Why It’s Important: A previous report showed that September is the worst month of the year for the S&P 500, dating back to 1928.
From 1928 through 2022, the S&P 500 was only positive in September 44% of the time. The average return of the S&P 500 for September in the stretch was down 1.2%.
Another potential positive for the S&P 500 along with it being an election year is the current momentum heading into September. Depending on what happens in August, September could start with the S&P 500 up double-digits year-to-date.
In years when the S&P 500 is up 10% to 20% year-to-date through August, the S&P 500 is up an average of 0.77% based on the previous report.
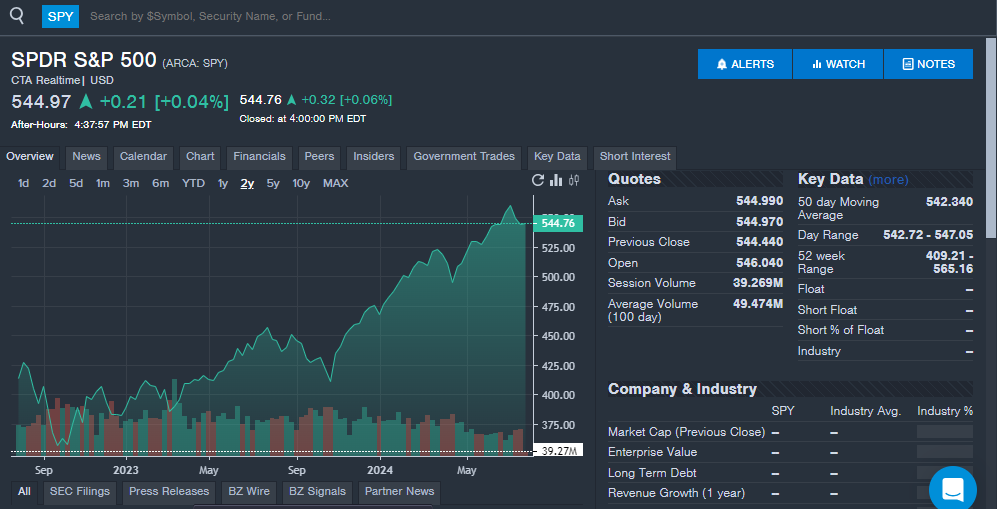
The Benzinga Pro chart below shows the past two August and September and their dips for investors.

Armed with 2024 being a presidential election year and the S&P 500 up double digits, investors could escape the August and September period with a positive gain, but past history shows that the next two months could be rough.
SPY Price Action: The SPDR S&P 500 ETF Trust closed at $544.76 on Monday with two full days left before August starts. The SPY has traded between $408.91 and $565.16 over the past year and is up 14.5% year-to-date in 2024.
Read Next:
Photo: Northallertonman via Shutterstock
Market News and Data brought to you by Benzinga APIs
© 2024 Benzinga.com. Benzinga does not provide investment advice. All rights reserved.

