
Bitcoin mining farm economics depend on the interaction between power cost, hashprice, ASIC efficiency, network difficulty and fleet uptime. Institutional operators need to model these variables together because relatively small changes in electricity pricing or mining revenue can materially alter operating margins, break-even thresholds and capital returns.
Bitcoin mining farm economics come down to one comparison: the revenue a fleet earns per unit of power it consumes, against the full cost of delivering and using that power. An industrial farm works when its hashprice, net of pool fees and downtime, stays above its all-in cost per megawatt-hour by enough margin to repay the capital it took to build the site and buy the machines. Every other variable in the model, from Bitcoin price to cooling design, feeds into that comparison.
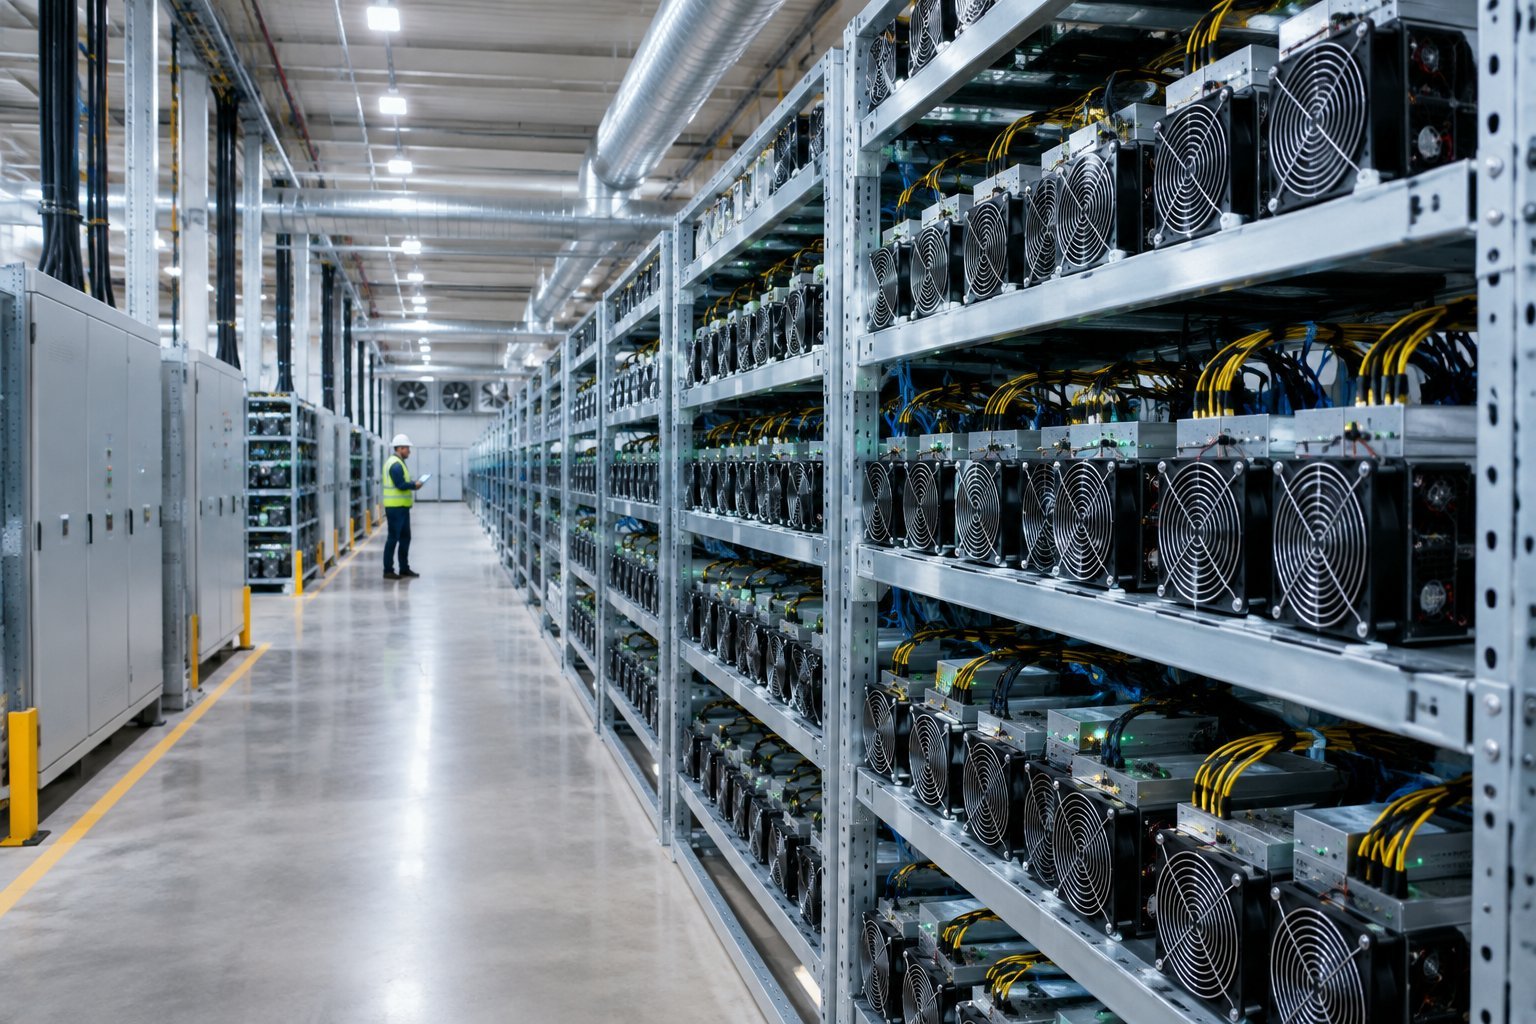
The stakes are large. U.S. cryptocurrency mining may account for 0.6% to 2.3% of national electricity use, based on preliminary federal estimates. At that scale, small errors in power cost, uptime or fleet efficiency compound into large swings in operating profit. Bitcoin infrastructure is a competitive commodity business. Margins move with a market price no operator controls.
Two thresholds deserve separate treatment. The first is the power rate at which an existing fleet still covers its cash operating costs. The second is the much lower rate a new project needs to recover its capital. Investors and operators who keep those two numbers apart can judge whether to run, expand or exit a site. Readers weighing a specific site can start by writing down their own power rate, fleet efficiency and expected uptime, then testing them against the framework that follows.
Key Takeaways
- Hashprice, fleet efficiency and delivered power cost set the operating margin of any farm.
- The cash break-even power rate sits well above the rate needed to repay a new build.
- Scenario tests across price, difficulty, uptime and halvings show durability better than any single forecast.
Where Does a Farm’s Revenue Come From?
A farm’s revenue is the Bitcoin its hash rate earns, converted to dollars, minus what the pool keeps. The amount depends on the block subsidy, transaction fees, network hash rate, mining difficulty and the Bitcoin price, and hashprice combines all of them into one number.
How Block Subsidies, Transaction Fees and Pool Payouts Become Revenue
Each new block pays its miner a fixed block subsidy plus the transaction fees users attach. Since the April 2024 halving, the subsidy has been 3.125 BTC per block. Fees vary with demand for block space and have been a minority share of total miner income in most periods.
Industrial farms rarely mine solo. They join a pool, which combines hash rate and pays members in proportion to the work they submit. The payout method matters. Some pools pay a steady rate per unit of work regardless of luck, while others pass block luck through to members. A model should record which method applies, because it changes revenue variance and the effective fee.
How Hashprice Converts Computing Power into Expected Revenue
Hashprice is the expected daily revenue from one unit of hash rate, usually quoted in dollars per petahash per second per day ($/PH/s/day). It equals total network revenue in BTC (subsidy plus fees) divided by total network hash rate, multiplied by the BTC price.
Analysts prefer hashprice as the primary revenue input because it already nets out competition. A farm’s gross revenue then follows a simple form:
Daily revenue = hashprice × installed PH/s × uptime × (1 − pool fee)
This formula keeps the model honest. It ties revenue to hash rate that is running and accepted by the pool, and it leaves the nameplate figure out of the calculation.
How Bitcoin Price, Network Hash Rate and Difficulty Change the Result
Hashprice moves with the BTC price and against network hash rate. When price rises, mining pays more, new machines come online, and difficulty climbs at the next adjustment (about every two weeks). That pulls hashprice back down. When price falls, weaker miners shut off, hash rate drops and difficulty eases.
Economic research supports this feedback. A model in the Journal of Political Economy found that free entry places an upper bound on mining revenues, with a large share of rewards reinvested in equipment. For an operator, this means a price rally lifts margins only until competitors deploy more hardware.
How Much Does Electricity Cost at Farm Scale?
Electricity is the largest operating cost for nearly every farm, and the federal energy agency identifies it as the primary operating expense of a mining facility. The number that belongs in the model is the all-in delivered cost per megawatt-hour of useful mining load. The headline contract rate leaves out too much.
Contracted Rates vs. All-In Delivered Power Cost
A contracted energy rate covers only the commodity. The delivered cost also includes transmission and distribution charges, demand charges, ancillary fees, taxes and any losses through site transformers. Fixed-price power purchase agreements trade upside for certainty. Index-linked contracts expose the farm to wholesale spikes but allow it to profit from curtailment.
For comparison, the Cambridge Centre for Alternative Finance at the University of Cambridge assumes a global average miner power cost of $0.05/kWh in its electricity index. That is a modeling assumption, not a quote. Each site should replace it with its own delivered figure.
| Cost component | Fixed or variable | Typical treatment in the model |
|---|---|---|
| Energy commodity | Variable | $/MWh consumed |
| Transmission and distribution | Mostly variable | $/MWh or tariff schedule |
| Demand charges | Fixed per month | $/kW of peak draw |
| Taxes and riders | Variable | Percent of bill |
| Transformer and line losses | Variable | Added MWh |
Miner Consumption, Cooling Loads and Facility Overhead
Miners consume most of the site’s power. Fans, pumps, networking and lighting add the rest. Power usage effectiveness (PUE) captures this as total site power divided by IT power. A PUE of 1.05 means 5% of the bill buys no hash rate.
The cost per MWh delivered to the miners therefore equals the site rate multiplied by PUE. Operators who quote cost per MWh at the meter, without that adjustment, understate their true cost of producing hash.
Curtailment Economics and the Value of Flexible Power
A mining load can shut down within minutes, which gives it value to grid operators. In Texas, ERCOT’s Large Flexible Load program enlisted up to 1,530 MW of industrial load to curtail during peak demand, and miners are major participants, according to the federal energy agency’s 2024 analysis.
Curtailment works in a farm’s favor when the value of power sold back or avoided exceeds the hashprice it forgoes. On an index-priced contract, shutting down during price spikes cuts average cost per MWh actually used. The trade-off is lower uptime, which spreads fixed costs over fewer productive hours.
How Do Fleet Efficiency and Uptime Affect Output?
Efficiency sets how much power each terahash costs, and uptime sets how much of the installed fleet earns revenue. A low-cost site with a weak fleet or poor availability can earn less than a pricier site that runs efficient machines close to full time.
Comparing ASIC Fleets by Joules per Terahash
Joules per terahash (J/TH) measures energy per unit of work. A 1,000 W machine producing 10 TH/s runs at 100 J/TH, the example Cambridge uses in its methodology. Current fleets run far lower, and each generation pushes the figure down.
Fleet efficiency should come from metered wall power and pool-side accepted hash rate. Nameplate figures leave out power supply losses, overclocking and wear. A weighted fleet average, using actual hash rate as the weight, gives the input the break-even formula needs.
Modeling Availability, Repairs and Hardware Degradation
Uptime splits into two parts. Capacity factor is the share of hours the power contract allows the farm to run. Availability is the share of allowed hours the fleet ran. Separating them shows whether lost revenue came from the contract or from operations.
Repairs, failed hashboards, firmware faults and dust all erode availability. A model should also include a hardware lifetime. Cambridge caps the economic life of ASICs at five years in its index, a reasonable outer limit for depreciation schedules.
When Air or Immersion Cooling Justifies Its Cost
Air cooling costs less to build and is simpler to service. Immersion cooling places miners in dielectric fluid, which allows higher overclocks, quieter operation and steadier chip temperatures in hot climates. It requires tanks, pumps, dry coolers and more involved repair workflows.
Immersion earns its cost when the added hash from overclocking, plus lower failure rates, exceeds the extra capital and pump power. That case is strongest at hot sites with expensive real estate and long expected fleet life. At cool, low-cost sites with standard air-cooled hardware, the extra capital often extends payback.
Which Operating Expenses Sit Beyond Power?
Operational expenses beyond electricity include pool and hosting fees, labor, maintenance, insurance, taxes and site administration. Each is small next to power, but together they move the break-even rate and decide how much a farm saves during curtailment.
Pool Fees, Hosting Terms and Revenue Deductions
Pool fees come out of revenue before any cost is paid. Aftermarket firmware often carries its own development fee, also taken as a share of hash. Both belong as deductions from gross revenue, so margins are measured on the BTC the farm receives.
Hosted miners pay a hosting rate that bundles power, space and labor. Some contracts add profit sharing or minimum payments during weak hashprice periods. These terms shift risk between host and client, and they need explicit modeling in each scenario.
Labor, Maintenance, Insurance and Site Administration
Staffing, security and maintenance scale with fleet size and site count. Further costs include insurance (property, business interruption and liability), property and sales taxes, monitoring software, and the working capital or credit support that utilities and lenders require.
| Expense | Scales with | Model as |
|---|---|---|
| Technicians and security | Headcount, site count | Fixed monthly |
| Repairs and spare parts | Fleet size, age | Per machine per year |
| Insurance | Asset value | Annual fixed |
| Property tax | Assessed value | Annual fixed |
| Monitoring software | Machine count | Per machine |
| Pool and firmware fees | Revenue | Percent of revenue |
Fixed vs. Variable Costs During Curtailment
When a farm curtails, it stops paying for energy but keeps paying staff, insurance, taxes and most demand charges. A model that treats all costs as variable will overstate the savings from shutting down.
The correct test for a curtailment hour compares forgone net revenue with avoided variable cost plus any grid payment. Fixed costs stay the same either way, so they drop out of that decision. They still count when judging whether the site deserves to stay open.
What Is the Break-Even Power Price?
The break-even power price is the highest delivered rate per MWh at which a fleet’s mining revenue still covers a given set of costs. It is expressed in dollars per MWh so it can be compared directly with a power contract.
Calculating the Rate at Which an Existing Fleet Covers Operating Costs
One PH/s at an efficiency of E J/TH draws E kilowatts. Over a day, that equals 0.024 × E MWh. The revenue each MWh produces is therefore:
Break-even power price ($/MWh) = hashprice × (1 − pool fee) ÷ (0.024 × E × PUE)
As an illustrative calculation only: a fleet at 20 J/TH with a PUE of 1.05 consumes about 0.504 MWh per PH/s per day. If net hashprice were $50/PH/s/day, the cash break-even would be about $99/MWh before other operating costs. Subtracting non-power operating costs, expressed per MWh, gives the rate at which running the fleet still covers its cash costs.
Distinguishing Cash Break-Even from Full-Cost Break-Even
Cash break-even answers whether the fleet should keep running today. Machines already bought are sunk costs, so if net revenue per MWh exceeds the variable cost of power and operations, running adds cash.
Full-cost break-even answers whether the project should have been built. It adds depreciation of ASICs, recovery of site and interconnection capital, and the cost of debt or equity. That threshold sits lower, often far lower. A site can clear cash break-even comfortably while destroying capital on a full-cost basis.
| Threshold | Includes | Decision it informs |
|---|---|---|
| Power-only break-even | Electricity | Run or curtail this hour |
| Cash break-even | Electricity plus cash operating costs | Keep the site operating |
| Full-cost break-even | Cash costs plus capital recovery and financing | Build, buy or expand |
Why the Threshold Changes with Hashprice and Efficiency
Break-even rises in a straight line with hashprice and falls as J/TH rises. Halving the fleet’s J/TH roughly doubles the power rate it can afford. A 20% fall in hashprice cuts the break-even rate by 20%.
This is why older machines drop out first in a downturn. Cambridge’s index assumes miners act as rational agents and run only hardware that remains profitable at their electricity price. Its threshold for profitable efficiency has fallen steadily over time.
What Capital Must a Farm Recover?
Capital expenditures fall into three groups: machines, site infrastructure and the reserves needed to keep a fleet competitive. Each recovers on a different schedule, and the full-cost break-even must cover all of them.
ASIC Purchases, Interconnection and Site Buildout
ASICs are the largest and fastest-depreciating asset. Their market value tracks hashprice, so a machine bought near a market peak can lose much of its resale value within months.
Site capital includes substations, transformers, switchgear, buildings or containers, cooling systems and the utility interconnection itself. These assets last longer than any miner generation. They should depreciate over a longer schedule and be modeled apart from hardware.
Commissioning Delays and Fleet Replacement Reserves
Delays between buying machines and energizing them cost revenue twice. The hardware ages while network difficulty keeps rising. A model should include a realistic commissioning date and accept that early-period revenue may come in below plan.
Fleets also need replacement. As difficulty rises and new models arrive, older machines move toward their break-even. A replacement reserve, funded from operating cash flow, keeps the site’s average J/TH competitive without a sudden capital call.
Owned Facilities vs. Hosted Capacity
Owning the site gives control over power contracts, curtailment revenue and long-term asset value, at the cost of large upfront capital and slower deployment. Hosting turns site capital into an operating expense through a per-kWh or per-machine rate.
| Factor | Owned facility | Hosted capacity |
|---|---|---|
| Upfront capital | High | ASICs only |
| Power cost control | Direct | Through contract |
| Curtailment revenue | Retained | Often shared or kept by host |
| Deployment speed | Slower | Faster |
| Counterparty risk | Utility | Host and utility |
Which Metrics Show Whether the Project Works?
A project works when it shows positive operating profit after all costs and returns its invested capital within the useful life of the fleet. Reporting each layer of profit separately makes clear where margin is earned and where it leaks.
Separating Revenue, Electricity Cost and Operating Profit
A clear income statement for a farm follows this order:
- Gross mining revenue (hashprice × running hash rate)
- Less pool and firmware fees
- Less delivered electricity
- Less other cash operating costs
- Equals operating profit before depreciation
Reporting electricity as its own line shows how exposed the business is to power markets. Industry data show how fast that share can shift. After the 2024 halving, network electricity cost rose from 40% to 67% of block rewards between April and May 2024.
Calculating Gross Margin Without Hiding Overhead
Hashcost is the all-in cost to produce one PH/s per day. Comparing it with hashprice gives a margin that is easy to track over time. Gross margin should include delivered power and direct site costs at a minimum.
Some operators report power-only margins, which flatter results. Analysts should rebuild the margin to include labor, repairs and site overhead, then compare it with peers on the same basis.
Measuring Cash Payback and Returns on Invested Capital
Cash payback is total capital divided by monthly operating profit, with profit modeled month by month as difficulty rises. A flat-revenue payback calculation overstates returns. Return on invested capital compares annual operating profit after depreciation with total capital deployed, including working capital and credit support.
What Do Scenario Tests Reveal?
Scenario tests show how far key inputs can move before the project fails a given threshold. They replace a single forecast with a range of outcomes and expose which assumptions carry the most risk.
Setting Explicit Base, Adverse and Favorable Assumptions
Each scenario should state every input, not just price. A useful set fixes the following for each case:
- BTC price path and monthly network hash rate growth
- Transaction fee share of revenue
- Delivered power cost per MWh and PUE
- Fleet J/TH and degradation rate
- Capacity factor and availability
- Pool fee, hosting terms and replacement reserve
| Input | Adverse | Base | Favorable |
|---|---|---|---|
| Hashprice trend | Falling | Flat to declining | Rising |
| Difficulty growth | Fast | Moderate | Slow |
| Delivered power cost | Contract plus spikes | Contract rate | Contract minus curtailment credits |
| Availability | Lower | Plan | Higher |
| Commissioning | Delayed | On schedule | Early |
Stress-Testing BTC Price, Hashprice and Power Rates
Analysts should test hashprice directly instead of BTC price alone. Price and difficulty move together over time, so a price shock without a hash rate response overstates the damage in the short term and understates it later. The key output is the hashprice at which the farm hits cash break-even, compared against the historical range.
Power stress tests should cover both a higher contract rate and a period of extended curtailment. Both raise cost per productive MWh.
Testing Efficiency, Uptime and Payback Sensitivity Together
Inputs interact. A fleet with worse J/TH and lower availability in an adverse hashprice period can see payback stretch past the hardware’s useful life. A two-way table of hashprice against availability, with payback months in each cell, shows that risk at a glance. If payback in the adverse case exceeds about five years, the project depends on a favorable market to return capital.
How Do Halvings and Alternative Uses of Power Affect the Model?
Halvings cut the largest revenue source on a fixed schedule, and alternative power uses set the opportunity cost of mining. Both belong in any model longer than a few years.
Accounting for Lower Future Block Subsidies
The subsidy halves about every four years. The next cut, expected in 2028, will reduce it from 3.125 BTC to 1.5625 BTC. The 2024 event showed the effect: block rewards fell 46% in dollar terms, from $1,782 million to $966 million, between April and May 2024, according to the same industry analysis cited above.
A model should cut subsidy revenue on the scheduled date and assume no automatic price offset. Bitcoin miners with weak fleets exit after halvings, which lowers difficulty, but that relief arrives with a lag.
Evaluating Grid Payments and Other Revenue Streams
Demand-response payments, ancillary service revenue and sales of contracted power back into the market can add real income for flexible loads. These streams depend on market rules and contract terms, so they belong in a separate revenue line with their own scenarios. Some sites also sell waste heat, though that market is small and local.
Comparing Mining with Alternative Uses of Site Capacity
Powered land with an interconnection has value beyond mining. Large public miners have redirected capacity toward AI and high-performance computing hosting, which pays contracted revenue with lower price volatility but needs far more capital per megawatt. The right comparison is risk-adjusted return per megawatt of interconnection, since that capacity is often the scarcest asset a farm holds.
Choosing Assumptions That Survive a Downturn
The assumptions that hold up best are the ones that still return capital when hashprice stays low. Operators and investors should model delivered power at full cost including PUE, demand charges and taxes. Fleet efficiency should come from metered wall power and pool-side hash, and uptime should split into capacity factor and availability.
Keep the three thresholds separate: power-only, cash and full-cost break-even. Test each against adverse hashprice, faster difficulty growth and the next halving. Fund a replacement reserve from operating cash flow. A project that pays back within the useful life of its fleet under the adverse case, without counting on grid payments or a price rally, has a model built to last
Bitcoin mining farm economics should be evaluated through scenario analysis rather than a single profitability estimate. Operators can stress-test power prices, hashprice, network difficulty, fleet efficiency and uptime to determine how quickly margins compress under adverse conditions. This approach helps distinguish facilities with durable cost advantages from operations that remain profitable only under favorable market assumptions.
A disciplined bitcoin mining farm economics framework should also separate operating profitability from full-project economics. Electricity cost and pool fees may determine near-term operating margin, while hardware replacement, infrastructure capex, maintenance, financing and other expenses determine longer-term returns. Institutional analysis therefore focuses on break-even power cost, cash-flow resilience and the capital required to keep the mining fleet competitive.
Frequently Asked Questions
Are industrial Bitcoin mining farms still profitable?
Farms with low delivered power costs and efficient fleets can still earn operating profit. Profit depends on the gap between hashprice and each site’s all-in cost per PH/s. Older fleets on high-cost power face the tightest margins, especially after a halving.
What electricity price makes a Bitcoin mining farm profitable?
The profitable rate equals net hashprice divided by the fleet’s daily MWh per PH/s, adjusted for PUE. It changes with every hashprice move and fleet upgrade. A new project needs a rate well below cash break-even to recover its capital.
How does hashprice affect a farm’s break-even point?
Break-even power price moves in direct proportion to hashprice. A 20% drop in hashprice lowers the affordable power rate by 20% for the same fleet. Better efficiency raises the threshold, which is why efficient machines survive downturns longer.
How long does it take for a mining farm to recover its investment?
Payback depends on capital cost, power rate, uptime and the hashprice path, so it should be modeled month by month as difficulty rises. Projects whose adverse-case payback exceeds the fleet’s useful life, roughly five years at most, rely on favorable markets to return capital.
What happens to farm economics when the block subsidy halves?
Subsidy revenue drops by half overnight, which cuts hashprice sharply unless price or fees offset it. After the 2024 halving, electricity cost as a share of rewards rose from 40% to 67% in one month. Weaker miners exit afterward, easing difficulty with a lag.